Traditionally, knowledge base and other self service investments are made on the assumption that there will be a significant improvement to customer service and support, and self service reduces the use of more costly channels e.g. voice, chat & email.
Given the growth in the preference for self service, and the scale of today’s self service projects, relying solely on those assumptions, rather than hard numbers, will often jeopardise your business case.
Quantifying self service ROI will assist you to:
- improve your digital support services through prioritised investment
- accurately forecast customer volumes switching to self-service channels, this will help inform your contact centre resource planning
- perform effective and prioritised content improvement
This methodology has been successfully implemented by Connections Ltd a number of times using multiple types of knowledge management systems, whether you’re using Oracle Service Cloud, Salesforce Knowledge or any other solution that allows you to run simple usage reports. Most required numbers are often easy to obtain or are already known within the orgainisation e.g. resourcing information, knowledge base traffic volumes and ratings. Some values however will require additional effort e.g. Contact Deflect Multiplier.
Instructions
- All entered values must be related to the same date range e.g. last 3 months or last 12 months, etc.
- Page views: number of individual views received by a KB article
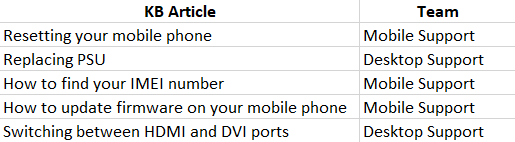
- Grouping all KB articles by relevant Contact Centre teams/departments – every individual article is looked at and is tagged against one specific contact centre area that would be most likely to have to resolve the query had this KB article not been there. As a result you’ll end up with a list of articles and relevant teams. To avoid double counting no article can be related to more than one team. Example:
- Once all articles have been attributed to a particular team simply add all page views for a particular time period for each team.
- Grouping all KB articles by relevant Contact Centre teams/departments – every individual article is looked at and is tagged against one specific contact centre area that would be most likely to have to resolve the query had this KB article not been there. As a result you’ll end up with a list of articles and relevant teams. To avoid double counting no article can be related to more than one team. Example:
- Ratings: customer satisfaction measure against each article or an average measure across multiple articles displayed as a percentage e.g. an article was rated as “helpful” 10 times and as “unhelpful” 6 times therefore the overall rating for this article is 10/16 = 62.5%
- Include % symbol when entering the value
- Set a minimum number of ratings that need to be entered against an article before it’s ratings is included in the calculation e.g. an article with only 2 ratings will produce a biased figure. We found the best cut-off value is a minimum of 5 ratings before the article’s rating is included. Example:
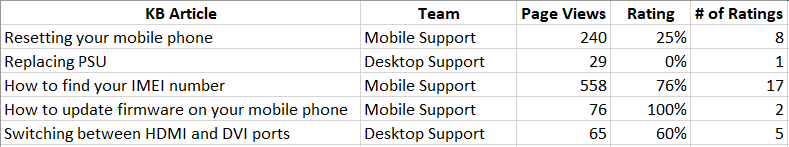
In this case any article which has been rated less than 5 times will not be included in the rating calculations. - Calculate the weighted ratings value (weighted against traffic for each KB article). Using the above example (keep in mind we ignore articles with less than 5 ratings):
- Mobile Support weighted rating is: ((240*0.25)+(558*0.76))/(240+558)=61%, whether if we took a straight average disregarding the traffic volumes the average rating would have been 51%